Coronavirus Data Analysis Made Easier
MARCO BONETTI, DIRECTOR OF THE DONDENA CENTRE, HAS DEVELOPED A TOOL THAT DISPLAYS THE PROGRESS OF THE EPIDEMIC AT PROVINCIAL, REGIONAL AND NATIONAL LEVELSMarco Bonetti, Director of the Dondena Centre for Research on Social Dynamics and Public Policy at Bocconi, along with Ugofilippo Basellini (Max Planck Institute for Demographic Research and Institut national d’études démographiques), created an open source tool to facilitate the visualization of the coronavirus’s spread and local trends. «The tool uses the free statistical program R, widely used in the scientific community, and displays Italian data on the number of people infected, hospitalized or deceased», says Professor Bonetti. A beta version of an online app that shows the results of the analysis updated in real time is also available.
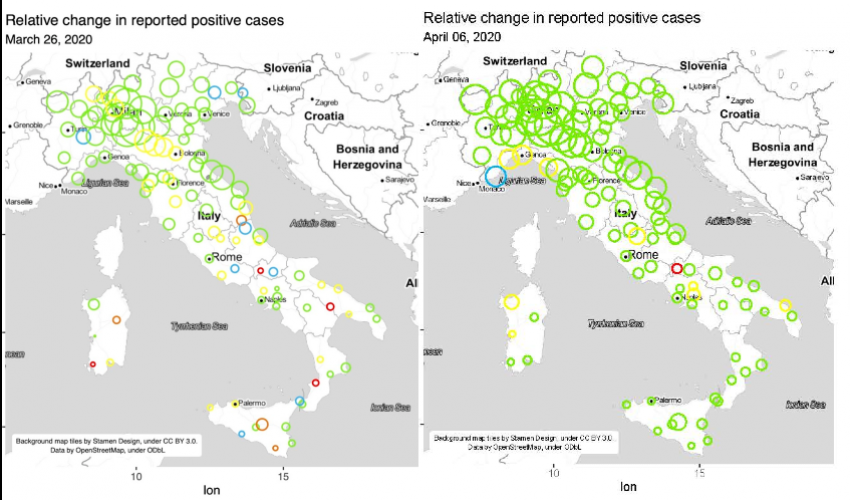
The program incorporates official data at the provincial level and, through a simple statistical process, summarizes the trend that the epidemic has followed so far at the local level. The result is a graph for each province and region, including cumulative data on contagions (or other variables) and an interpolation curve. Next to the graph, there is an indication of the estimated relative growth rate of the curve on the day of analysis. This translates every day into a map of Italy (in the image, the comparison between maps from 26 March and 29 March), in which each province corresponds to a circle. The size of the circle corresponds to the number of events up to the day of the analysis, while the color of the circle indicates the speed of growth at the time of the map. For example, green circles indicate provinces where the growth of contagion is modest, while red circles indicate provinces where it is high.
Bonetti, Full Professor of Statistics at the Department of Social and Political Sciences at Bocconi, described the analysis and the tool in a working paper free to download by clicking here. The code can be downloaded by clicking here, and the national map is updated daily and can be consulted by clicking here. The beta version of the online app is available by clicking here.
«The objective of this type of analysis is to follow the progress of the epidemic in the different areas of the territory,» concludes Bonetti, «and great caution is needed when extrapolating on the future».
by Fabio Todesco
